Evaluation Results averaged over the whole Benchmark
Each of the four bar charts shows a different evaluation metric computed for all seven algorithms and averaged across the entire data set. Added to each chart is a bar representing the human-generated segmentations evaluated with respect to one other (labeled "Human," on the left) and two bars representing trivial segmentation algorithms ("None" = all faces in one segment, and "Every"= every face in a separate segment). In all cases, lower bars represent better results.
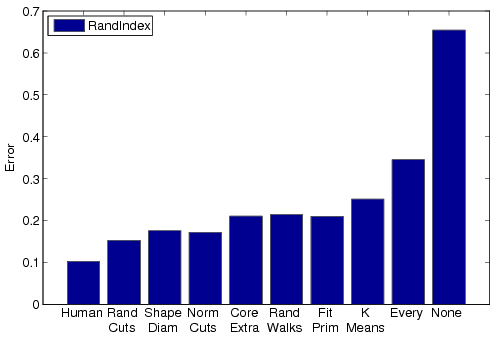
Rand Index |
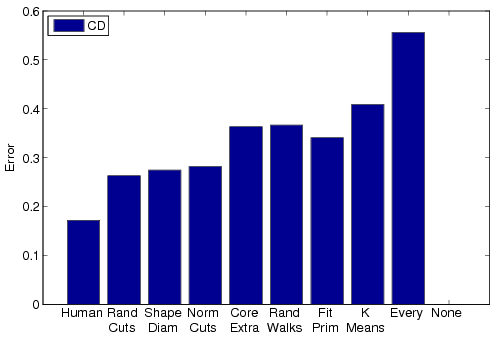
Cut Discrepancy |
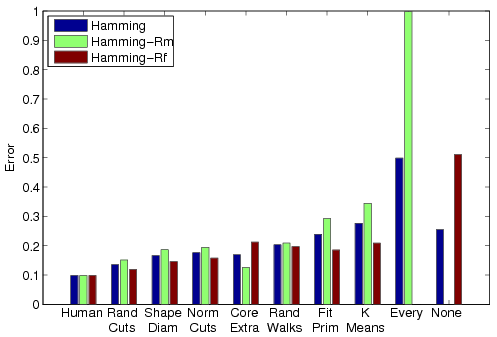
Hamming Distance |
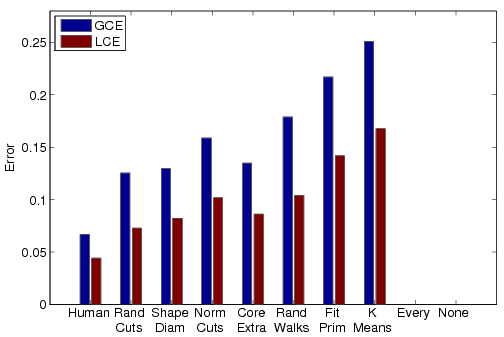
Consistency Error |